Its been a difficult couple of days for equity investors, particularly if you are exposed to technology stocks and given the weighting of the Mag 7, on a global basis, that’s pretty much everybody.
In times like this I find it useful to look at things from a top down perspective, tables like those shown below are helpful in this regard.
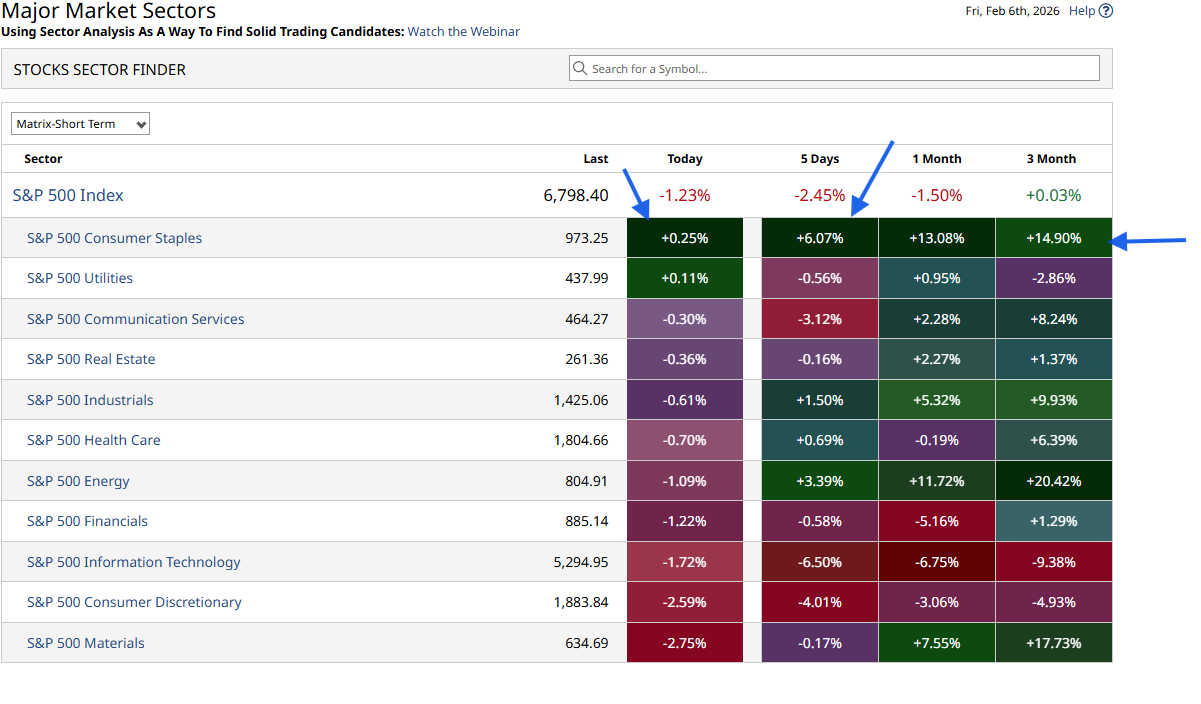
The first table shows us the performance of S&P 500 sectors over intervals out to the last 3-months.
What’s clear from this is that the rally in Consumer Staple’s hasn’t happened over night, but rather over the last quarter- clearly the signs were there, if you new where to look.
I note though that the upside move came to halt yesterday, has the sector had its moment(um) in the sun?
That’s something to look at in today’s session, and the weekly close for both the sector and constituent stocks could be very instructive.
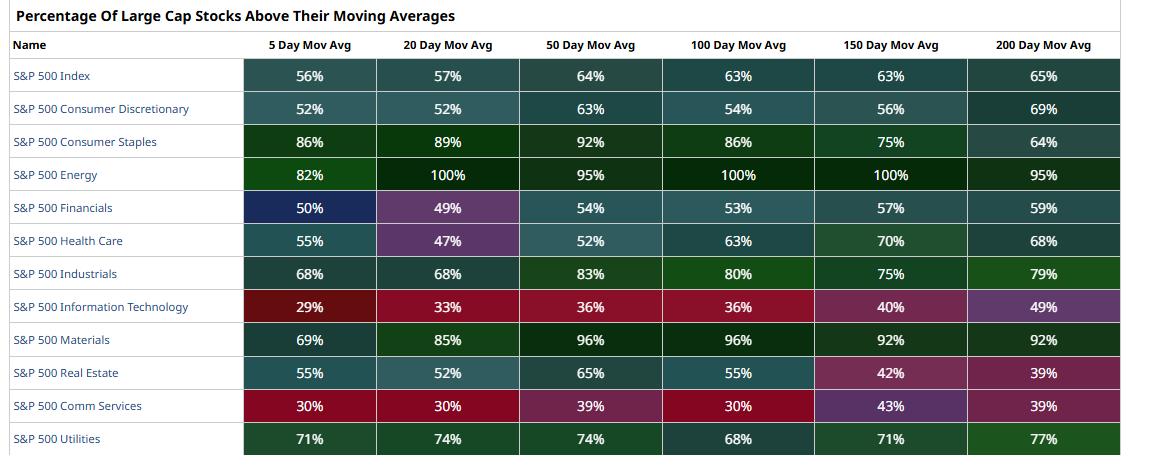
The second table looks at breadth in the market in this case measured by the percentage of stocks in S&P sectors, that are trading above or below key Moving Averages.
Given the ” blood letting in recent days, I am surprised to see that the respective percentages in Comms Services and Information Technology, aren’t lower than they are.
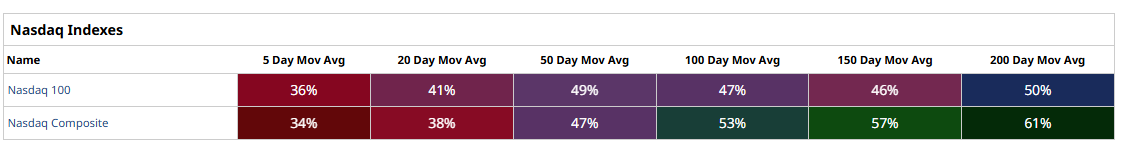
I have added the data for the Nasdaq 100 and Composite indices for context, see table three.