-
Jackson Wong posted an update
4 months agoWhat is Microsoft’s chart trying to tell us?
Microsoft is one of the largest tech companies in the world (market cap $3.4 trillion).
A dominant (or monopolistic?) player in the first PC revolution, the company was able to pivot successfully to other booming tech areas, such as gaming, cloud and now, AI. Its corporate longevity in a hyper competitive industry, famed for its rolling ‘creative destructiveness’, is legendary. MSFT stood at the apex of global listed companies numerous times.
But MSFT’s share prices in recent weeks have developed some persistent weakness. On Wednesday, prices slipped to its lowest level in 26 weeks.
More worryingly, MSFT slipped beneath its long-term trendlines (150- and 200-day MA). Its relative strength against the S&P (as proxied by SPY) has also slumped to multi-week lows.
I highlight MSFT’s toppy chart for two reasons.
One, does it mean that the AI boom is coming to an end? When investors are dumping one of the strongest (and profitable) Big Techs, perhaps we should start to pay attention.
Two, as one of the first stocks to recover after the chaotic ‘Liberation Day’ tariffs hikes last May, does MSFT’s steady decline suggesting a wider market decline ahead?
Perhaps this is an overly bearish take on MSFT’s chart.
Optimists would argue few other large techs – META, NFLX, ORCL – are too at some distance below their 52-week highs. Yet the S&P hit new all-time highs in 2026. So MSFT’s chart is nothing to worry about.
That may be true. But I wouldn’t discount MSFT’s chart as an “aberration”. Its price and relative weaknesses are glaring. Any further decline (next earnings report January 28) may spark more momentum selling. MFST needs a firm upward dynamic to regain confidence in the AI/BigTech play.
-
Darren Sindenreplied 4 months ago
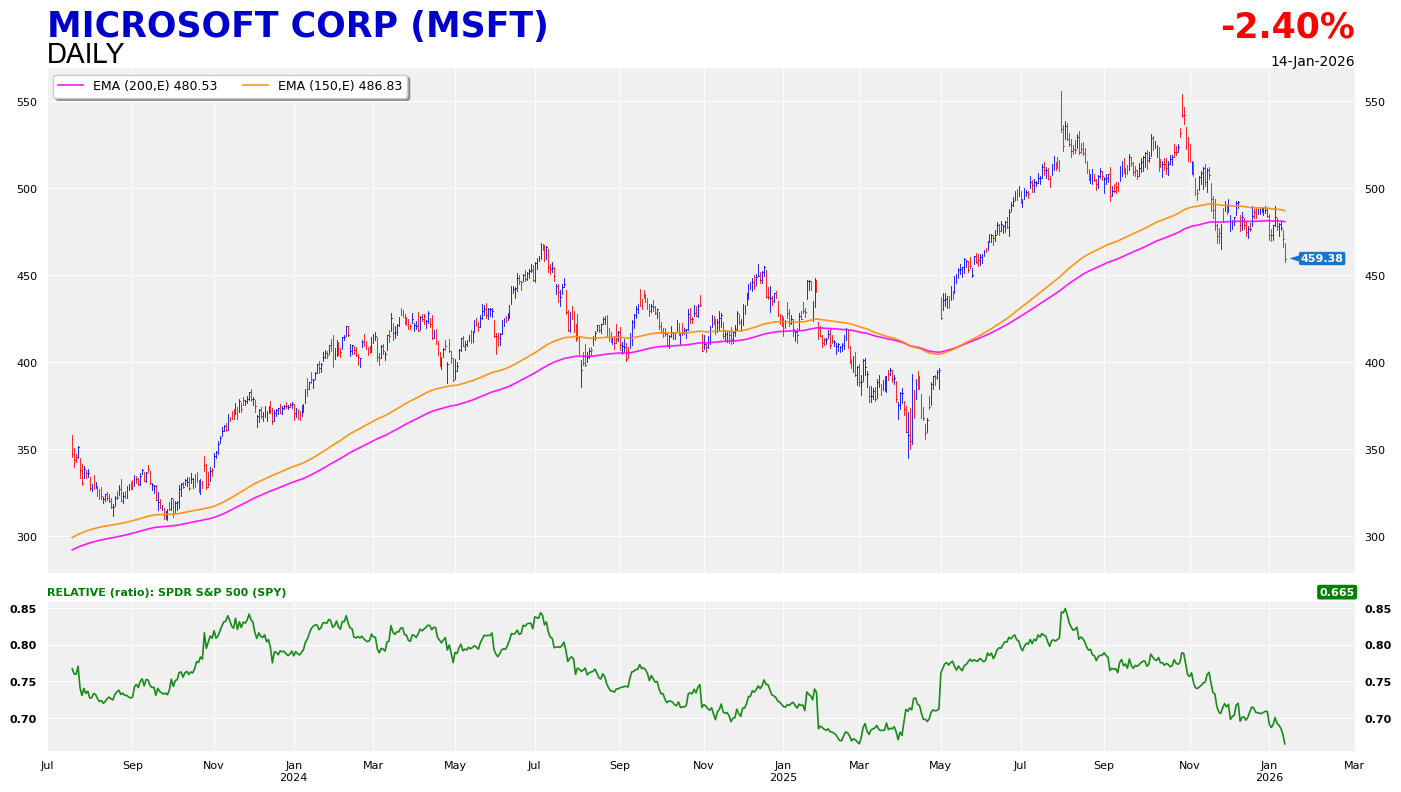
I thought this comment on the 2025 performance divergence between software and chips was quite telling .
like
like
dislike
-

