S&P 500 notches another milestone!
The roller-coaster in gold and silver prices over the last weekend was highly captivating. But that was not the only important development in financial markets.
One should remember this too: the S&P 500 just touched 7,000 for the first time in its 69-year history (on January 28).
That is the highest level attained, meaning every single holder of the instrument (via funds, ETFs or futures) is sitting on healthy profits.
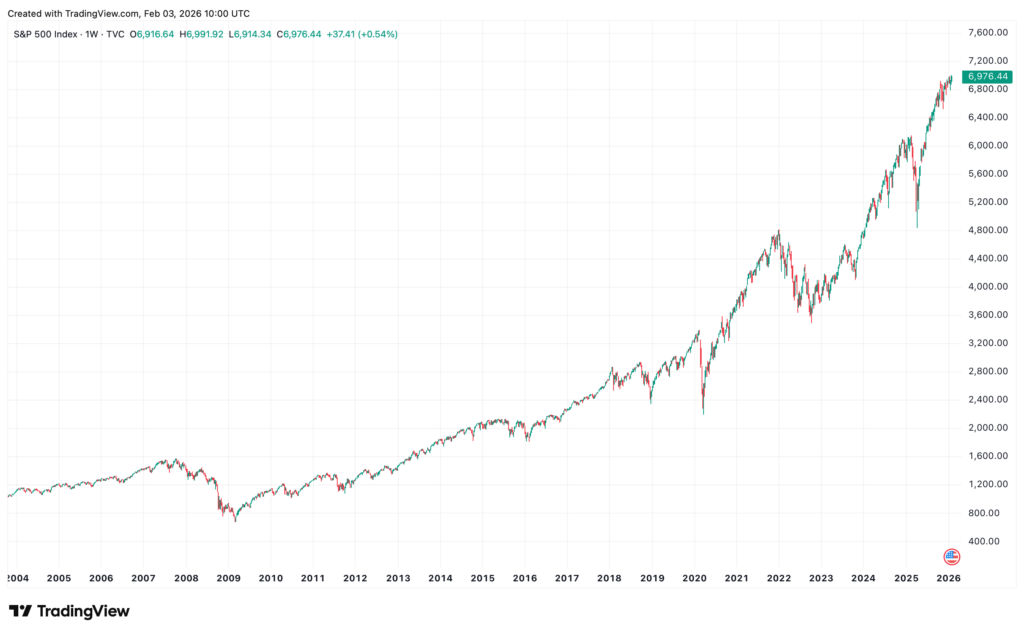
You can see how far the S&P has advanced in the past decade from its weekly chart below. Despite its length and performance, the $58-trillion S&P remains in an unshakeable and robust bull trend.
From the March 2009 secular low of 666 to the latest milestone at 7,000, the SPX has gained an astounding 950 percent! That’s near the proverbial 10-bagger. If I were to include those reinvested dividends from the index during this 17-year holding period, the total returns would be far higher.
In light of S&P’s 666-to-7,000 secular bull cycle, I’d like to discuss three important points.
Long-term passive investing reaps large rewards
One, passive investing can yield tremendous profits for long-term holders. Yes, the stock index seems boring at times. But investing isn’t supposed to be exciting day in, day out (like silver these days).
You can build a sizeable nest egg over time by compounding capital, dividends and interests year after year. The key here is compounding – the ‘eighth wonder of the world’ – and let those capital seed corns grow healthily.
This is what Warren Buffett had to say about the S&P a decade ago, after winning a decade long bet on whether professional investment managers can outperform the S&P. They can’t:
There’s no doubt in my mind, however, that the S&P 500 will do better than the great majority of professional managers achieve for their clients after fees.
Be optimistic
Two, the next important point worth stressing is this: the S&P managed to gain 2,000 points in recent quarters despite the following bearish macro factors:
- Liberation Day Tariffs chaos
- Fed Funds Rate staying above 3 percent
- Bearish consumer sentiment readings (eg, see data here)
- Increased military conflicts globally (eg Ukraine, the Middle East), et cetera
This shows that the current US bull market is climbing what the old timers would call “a wall of worry”.
The lesson here is that investors should not be too focussed on the downside. Bull markets can, and often do, overpower this plethora of negatives and travel significantly higher than expected.
Right now, something (fundamentally) is happening in the US corporate world that is pushing the market relentlessly higher. The growing AI revolution is one; sustained corporate profits another.
For example, today (Feb 3) SpaceX is announcing a $250 billion deal to acquire xAI. The size of the combined company is valued at a spectacular $1.25 trillion. When this behemoth joins the US market in its June IPO, it will probably inject another shot of adrenaline into US large-cap indices.
Should you buy the S&P after a prolonged bull market?
Three, should we join the S&P party now, at 7,000?
Buying the S&P at 7,000 obviously entails different investment risk than buying it at 5,000. The index’s technical and valuation risk profile has changed significantly. How so?
a) The S&P concentration has deepened since 2023. The top 8 stocks ($21.7 trillion mcap) occupy an amazing third of the total index. Should this “Mag-8” wobble, it will slap the index violently around.
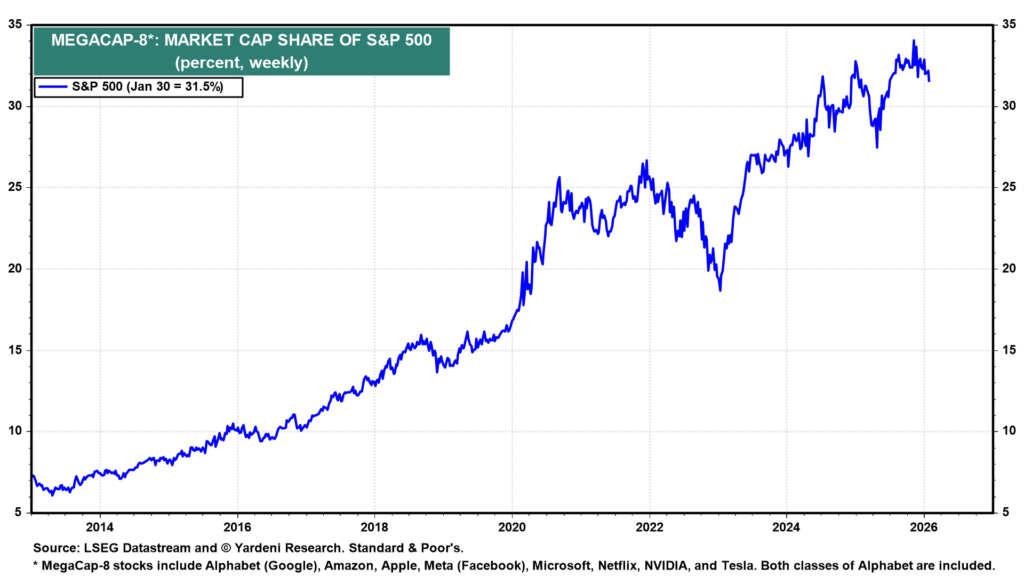
Source: yardeni.com (2026)
b) Long-term real return forecasts for large-cap US stocks have turned negative. This is calculated by the fund management firm GMO is its latest forecast (Dec-2025). The reason for this is that share prices of the sector have advanced modestly faster than their fundamentals (see below). Mean reversion remains a powerful force in stock markets.
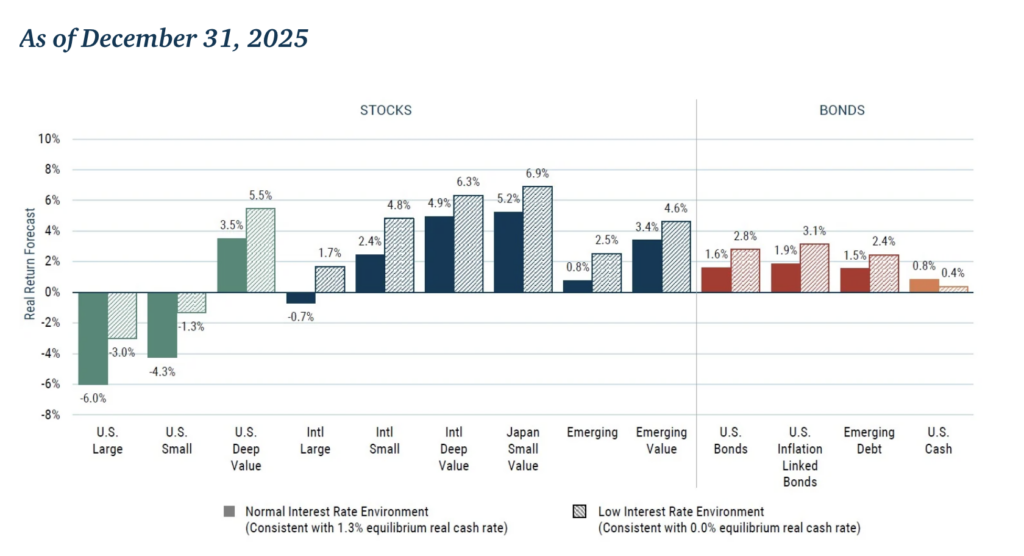
Source: GMO/Advisor Perspectives (Jan 2026)
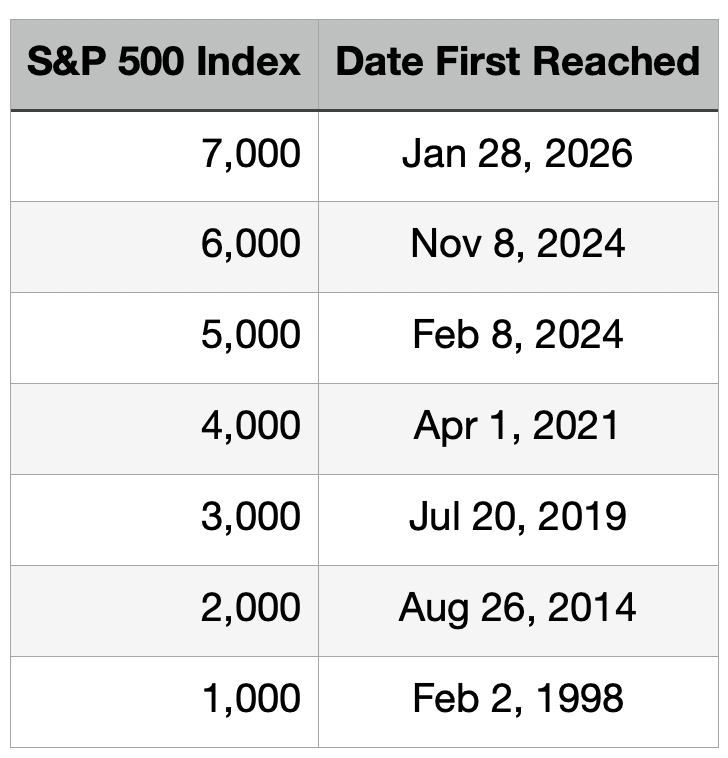
c) The pace of reaching each thousandth-level milestone (eg, 1,000, 2,000) has quickened. Look at the table below, where I tabulate the dates when the S&P first reached each thousand-point. To double from 1,000 to 2,000, the S&P took more than 15 years. The next 1,000-point rally from 2,000 required five years. The latest (6K to 7K) needed only 14 months. The pace has noticeably quickened. This is a sign of upward acceleration.
Will the S&P 500 reach 8,000?
When a roaring bull market is in motion, it is near unstoppable. Can the S&P surge another 1,000 point from here soon? Given its powerful upward momentum, chances of this happening are reasonably good.
Even the “perman-bear” veteran investor, Jeremy Grantham, recently conceded (Jan-2026):
For now, though, the key signs of a major bubble top—a collapse of the most speculative stocks, pronounced outperformance of quality stocks, and usually, a slowing of the rate of rise of the broad market—are not yet evident.
Long-term investors could thus stay in, rather than out. That said, having some liquidity on the sideline would be a good thing too, as it allows investors some firepower to engage in ‘buying the dips’.
